

Strategy
Following Bitcoin. But not blindly.
First the approach, then the expected result. A strategy that is systematic, defensive and defined in advance.

In brief
The Keystone-line steers
A composite trend indicator determines the direction. In an uptrend up to 100% Bitcoin, after a confirmed reversal largely or entirely out.
Phased and controlled
Positions are built up and scaled down in steps. Regulated parties only. No leverage, no short positions, no own wallets.
Added value over a full cycle
Over every period of four years or longer, the strategy historically outperformed Bitcoin, with a smaller drawdown.
Expected added value, also after costs
In all three scenarios the expected net return is above that of Bitcoin itself.
Deliberately prudent assumptions
We assume declining return expectations for both Bitcoin and the strategy. Returns from rotation are not included.
Bitcoin: early on the adoption curve
Scarce, without an issuer and accessible through regulated products. We estimate adoption at 10 to 15%. Read more
The strategy
The Keystone-line: the compass behind the decisions
The Keystone-line, or K-line, is a proprietary composite trend indicator. It combines several technical indicators across multiple time horizons of the Bitcoin price and answers two questions: in which direction is the price moving, and is momentum positive or negative?
The indicator does not predict the price. It shows, in a structured way, what the market is actually doing. That makes decision-making verifiable and repeatable, and keeps emotion out of the decisions.
The Keystone-line supports; the decision remains the manager's judgement within predefined boundaries. The manager also takes support and resistance levels and recognisable price patterns into account.
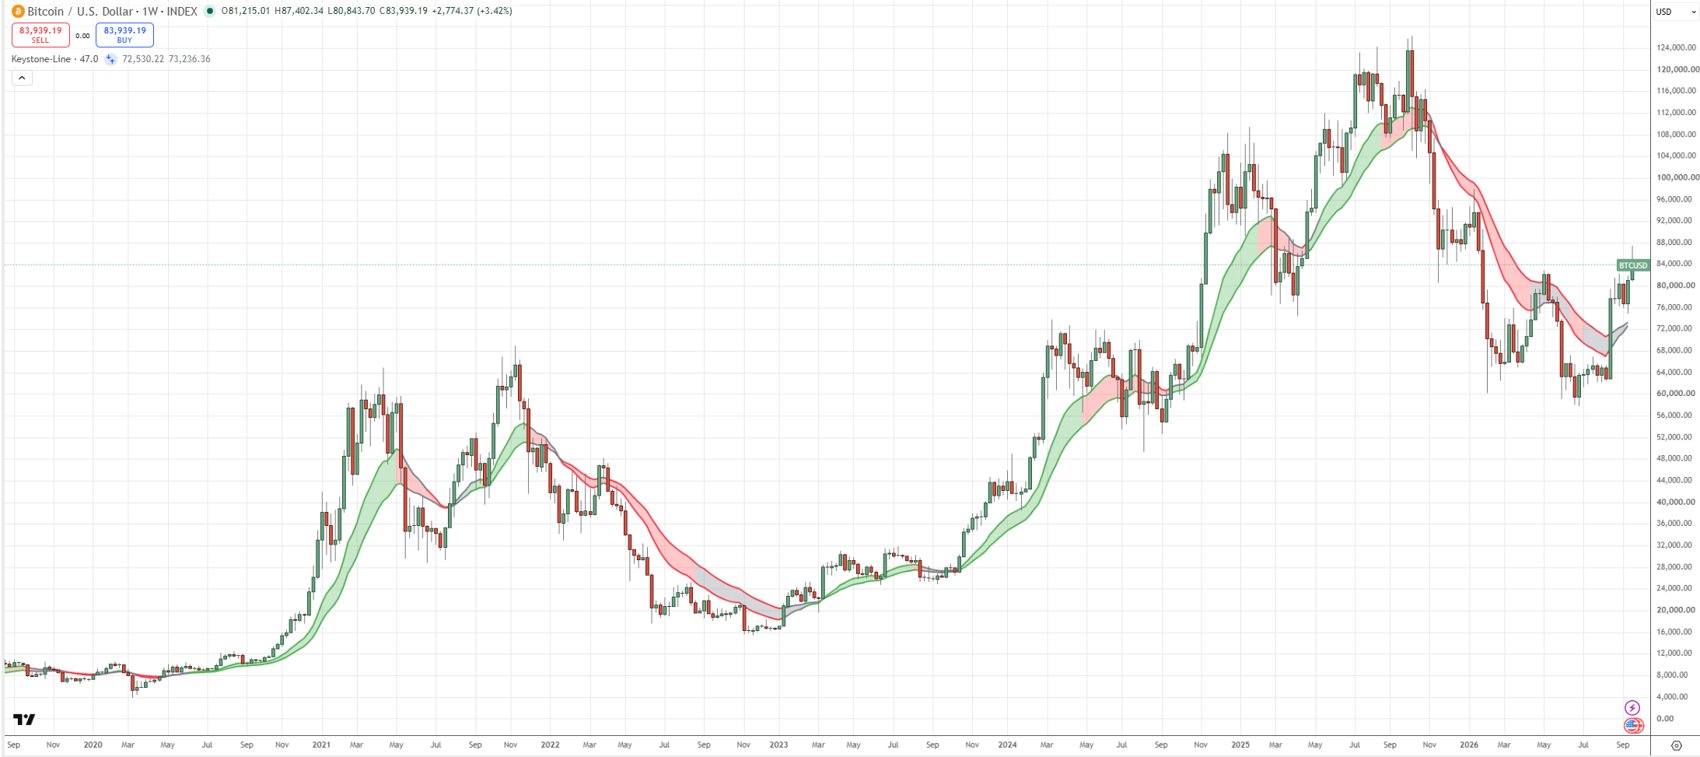
From signal to position
The strategy assumes a long-term upward trend in Bitcoin, interrupted by short corrections and occasionally by a longer, deeper decline.
Uptrend
In principle maximum exposure to Bitcoin, up to 100% of invested capital.
Weakening momentum
When momentum fades or selling pressure persists, exposure is gradually reduced.
Confirmed reversal
Most or all of the position moves to cash or to Opportunistic Positions.
Recovery
The position is only rebuilt once the indicators signal a resumption of upward momentum or a trend reversal.
Phased entry and exit, with an eye for price patterns
The fund enters and exits in steps. That way, the full capital is never converted at a single moment that later proves unfortunate. With every step, the manager weighs support and resistance levels and recognisable price patterns, so that after a correction a position can be built at a more favourable average price.
Rotation: capital keeps working
When the fund is in cash, it can temporarily take Opportunistic Positions: tactical investments in, for example, gold, commodities, energy or broad equity indices, via ETFs or index trackers. Bitcoin remains the core. Returns from rotation are not included in any results or expectations.
Controlled exposure
The fund invests through listed Bitcoin products (ETFs and ETPs) or holds Bitcoin directly with a crypto-asset service provider licensed under MiCAR. Execution and custody run exclusively through regulated parties. The base currency is the euro; dollar risk is not hedged.
- Regulated parties: MiFID II brokers and MiCAR-licensed crypto-asset service providers, spread where desirable.
- Segregated assets: the fund's assets are held in the name of a separate foundation, segregated from the manager's assets.
- Discretion within fixed boundaries, so that decisions remain verifiable.
- No leverage and no derivatives.
- No short positions. The strategy is long-only.
- No own wallets, OTC desks or unregulated exchanges.
Expected result
What the strategy delivered historically
Keystone-line strategy versus Bitcoin buy & hold, 1 January 2020 to 11 September 2026.
Until autumn 2025 this is a simulation on historical price data (backtest), calculated with full entry and exit and no return on cash. Since autumn 2025 the strategy has been traded live with capital outside the fund's assets, including phased entry and exit. The fund itself has no track record yet. Past results offer no guarantee for the future.
Strongest over four years or more
The strategy dampens Bitcoin's high volatility and in most cases also outperforms Bitcoin itself. Year by year the picture varies: in rising years the strategy can lag, because part of the rise is spent in cash. In falling years it is far ahead.
The longer the investment period, the greater the chance that the strategy beats Bitcoin. The simulation goes back to 2012; across all rolling periods since mid-2016, the outperformance was present in 100% of cases from four years onwards.
For our figures we deliberately use the more conservative period from 2020: an average outperformance of 20.3 percentage points per year. That is why we recommend a holding period of at least four years: one full market cycle.
Future expectation: deliberately prudent
For the future we use three scenarios for the Bitcoin price, derived from price targets by, among others, ARK Invest, Standard Chartered and VanEck, with a deliberate downward adjustment. We include only 30 to 70% of the strategy's historical outperformance, and after 2032 only half of that. A more mature market has smaller declines, and therefore fewer large price falls to avoid.
The average growth scenario is our starting point. The Information Memorandum is even more prudent: 15-25% growth for Bitcoin and a gross fund return of at most 25-35% per year.
| Scenario 2027-2032 | Bitcoin growthavg. annual % | Gross expectationbased on fund strategy | Net expectationafter fund costs | € 100,000net after 5 years |
|---|---|---|---|---|
| Moderate | 12.1% | 21.6% | 16.7% | € 216,000 |
| Average | 32.7% | 48.5% | 39.5% | € 529,000 |
| Positive | 51.4% | 73.6% | 60.9% | € 1,078,000 |
Expected return per year. Net after management fee, service fee and performance fee. Expectations are estimates, not guarantees. Loss of (part of) the investment is possible.
Get acquainted